


Is Human Intelligence Simple? Part 4: Searching for Animal IQ
Can we measure animal "smarts"?

Do animals have an analogue of the “g-factor” or “IQ”? That is, do the same individual animals tend to do well or poorly across the board at a battery of cognitive tests?
If we want to understand the evolution of intelligence before the origin of humans and hominids, we need to be able to make comparisons between the cognition of different animals and different animal species.
You can’t assume that giving literally the same test to different species of animals will give an interpretable comparison. For instance, if you gave an identical maze-running task to two species of rodents, you might find that the faster-running species solves the maze faster, for reasons that have nothing to do with cognition.
In order for cross-species comparisons to make sense at all, you’d want cognitive metrics that remain pretty robust to the details of task design — which means you’d need there to be heavy overlap in who does well on different tasks.
How Do We Test For The Presence of g?
First of all, you give a set of animals a battery of different cognitive tests, and measure their scores.
Now, you look at the pairwise correlations between the cognitive tests; you generate a covariance matrix.
One question you could ask is, are all the correlations in this matrix positive? This is known as the “positive manifold” criterion, and it’s a common empirical finding when you give a group of human test subjects multiple written cognitive tests.1
A related but distinct criterion is: what happens if we do PCA to the covariance matrix? Is the top eigenvalue greater than 1? If we project our dataset onto the top eigenvector (representing the direction of greatest variance), how much variance is explained by this one factor? How about the top several eigenvectors — how much variance do they explain?
If the correlation matrix was a random symmetric matrix, then (after normalizing), none of the eigenvalues would be greater than one. They would be distributed in a semicircle between -1 and 1, the famous Wigner semicircle. So a top eigenvalue well above 1 is extremely unlikely under the “null hypothesis” that inter-test correlations are independent and identically distributed with mean zero.
(In fact, the distribution of the top eigenvalue in a random Hermitian matrix is given by the Tracy-Widom distribution, so we can actually estimate numerically that p(top eigenvalue > 2) under the null hypothesis is < 0.02 or so.)
There also exist more complex methods, in which g is not computed as simply the top eigenvector in PCA but modeled as a latent variable in a hierarchical model. You can use various hypothesis testing criteria to compare the goodness of fit of different graphical models, with or without a “root node” representing g.
The upshot is, there are multiple statistical criteria that different authors will use to conclude “yes, this experiment confirms the existence of a g factor” vs “there’s no g factor here.”
For headline purposes, I’m going to treat each animal as a “yes” if all the experiments on that animal are consistent with a top eigenvalue above 2. Even if they have some other negative result like “no positive manifold”, because I suspect things like “small samples” and “imperfectly designed cognitive tests” might show up as occasional negative correlations which would disappear with scaled-up experiments.
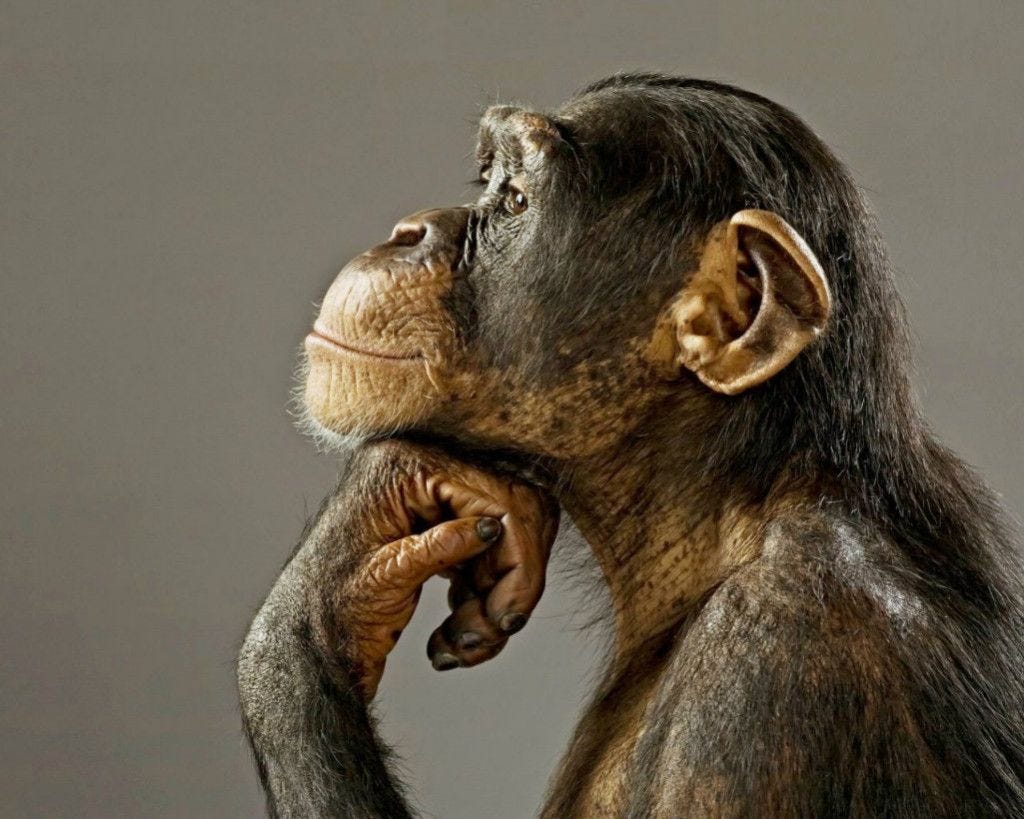
Chimps: Yes
99 chimpanzees2 were given the Primate Cognitive Test Battery (PCTB), consisting of 13 tasks involving things like remembering the location of food rewards, tracking the location of a food reward as it is hidden or rotated, discriminating between different quantities of food, following where a human points to a food reward, using tools to obtain a food reward, and so on.
After performing PCA, the top eigenvalue is 3.066 > 1.
The top eigenvector explains 23.59% of the variance, and the top 4 eigenvectors (which all have eigenvalues > 1), explain the majority (54.20%) of the variance, with each of these four factors being significantly correlated with a different subset of the tests.
In fact, 2 of these 4 factors, as well as overall g, were found to be heritable (to be more similar in more genetically similar chimps). The two heritable factors were also found to be genetically correlated with each other, indicating that the same genes might underlie both. The g factor had a heritability of h^2 = 0.525, p = 0.008, somewhat less than the heritability of IQ in adult humans.
Orangutans: Maybe
53 Bornean and Sumatran orangutans were given a cognitive test battery of 5 tests involving solving physical puzzles to find a food reward.3
There wasn’t a positive manifold; most, but not all, pairwise correlations between tests were positive.
After applying PCA to the test result data, the top eigenvalue was 1.56, and the principal factor explained 31.28% of the variance.
The study found a significant positive correlation between this principal factor (“g”) and a curiosity score; orangutans who explored more, were more “intelligent”.
Rhesus Monkeys: Yes
53 male and female rhesus monkeys4 of varying ages were given a battery of 6 tests measuring memory and learning. Upon applying PCA to the data, the top component explained 48% of the data, and loaded positively on all tests. There was a significant decline in cognitive performance (along this principal factor) with age.
Dogs: Maybe
68 border collies5 were given a variety of tests: 4 “detour tests”, in which a food treat was placed behind a clear barrier and the dogs had to figure out how to get to it; a “point-following test” in which a human points to one of two beakers and the dog has to turn over the pointed beaker; and a “discrimination test”, in which the dog has to choose between a larger or smaller quantity of food on a plate.
Task performance had low repeatability (the same dog’s performance on different trials of the same task only had weak correlations).
There also wasn’t a positive manifold; most, but not all, pairwise correlations between tests were positive.
The authors used a Bayesian estimator to compare the goodness of fit of multiple latent variable models.
The best-fit model was a “hierarchical g” model, in which g determines three variables (“navigation speed”, “choice speed”, and “choice accuracy”), and each latent variable depends on scores on a subset of tasks (speed on the detour tests, speed on the point-following and discrimination tests, and accuracy on the point-following and discrimination tests.) These top 4 variables together explained 68% of the variance; the higher-order g factor alone explained 17% of variance.
Cats: Maybe
A sample of 8 cats was given a battery of 3 cognitive tests.
There was almost, but not quite, a positive manifold; only one (nonsignificant) pairwise correlation was negative. Upon applying PCA, the top eigenvalue was 1.34; it explained 88% of the variance.
Deer: Yes
A sample of 8 zoo-housed fallow deer were given a battery of 8 cognitive tests involving learning which bucket contains food.
Applying PCA to the data found there were four top eigenvectors with eigenvalue >1; the largest had eigenvalue 5.311 and explained 23% of the variance.6
Rabbits: Yes
In a study of 10 rabbits7 given a battery of 3 spatial learning tests, there was a positive manifold (all pairwise correlations between tests were positive, and most were significantly so.)
The top eigenvalue was 1.71 and explained 95% of the variance.
Rats: Strain-Dependent
22 male Long-Evans rats8 were given tests in which they had to explore a maze or climb an inclined plane to find a food reward, as well as “novelty preference” test of how much time they spent exploring a novel object. All tests had significant positive correlation, there was only one eigenvector of the covariance data with eigenvalue >1 , and the score on this top factor correlated with brain weight.
On the other hand, 75 healthy adult male Sprague-Dawley rats9 given a battery of 4 tests show no evidence of a g factor. On average, the correlation between tests was zero.
When the data from the healthy rats was combined with data from 349 more Sprague-Dawley rats given experimental brain lesions in different locations, test performance did correlate, but this is hardly surprising; lesion brain damage of any kind will tend to make rats worse at all tests.
The Thompson studies (which showed no g in unlesioned Sprague-Dawley rats) and the Anderson studies (which showed g in Long-Evans rats) both used different tests and different rat strains. So what accounts for the different results, strain or test?
Repeating the experiment on Sprague-Dawley rats using 7 new tests, overlapping with both Thompson’s and Anderson’s original tests, plus additional ones, again found no g factor among the unlesioned animals. Scores on the 7 tests did not positively correlate. On the other hand, when lesioned animals were included in the dataset, a g factor popped out that explained 34% of the variance in the data, comparable to what is seen in human populations.
The authors conclude that Sprague-Dawley rats are simply too inbred to have much inter-individual variation in cognitive performance when unlesioned, so there’s no g factor for them, while the more outbred Long-Evans rats have enough variability that a g factor pops out.
Mice: Mixed Results
In a study of 40 heterogeneous (8-way cross) mice10, given a battery of 8 maze-related tests, there was almost, but quite, a positive manifold; all but two pairwise correlations were positive.
Applying PCA to the data yielded 4 top eigenvectors with eigenvalue >1; the top eigenvector had eigenvalue 2.50 and explained 30% of the variance.
In a study of 84 male and female outbred mice11 given the same battery of 8 maze-related tests, there was not a positive manifold; most but not all correlations between tests were positive. (Though all significant correlations were positive).
On the other hand, applying PCA to the data yields a top eigenvalue of 4.91 and a top eigenvector that accounted for 22% of the variance, even after regressing on sex.
All test scores (both speed and accuracy) correlated positively with that single factor.
A study of 60 heterogeneous (8-way cross) mice given a different battery of 6 maze-based tests found that there was not a positive manifold; most but not all correlations between tests were positive. Applying PCA yielded 4 components with eigenvalue >1, none of which loaded positively on all tests.12
A study of 56 outbred mice13 from a different strain, given a different set of 5 cognitive tests about maze learning, did find a positive manifold; all correlations between tests were positive.
Applying PCA to the data yielded a top eigenvalue of 1.92 and a top eigenvector explaining 38% of total variance.
Robins: Yes
20 wild-caught New Zealand robins14 were given a battery of 6 cognitive tests involving learning or memorizing where to find a mealworm.
There was no positive manifold in the data; most but not all correlations between tests were positive.
On the other hand, performing PCA on the covariance matrix revealed two principal components with eigenvalues >1, and the top component (which had eigenvalue 2.07) explained 34.46% of variance and had a positive correlation with all tests.
Bowerbirds: No
21 wild bowerbirds15 were tested on 6 cognitive tasks related to spatial problem-solving, vocal mimicry, and bower building. There were no significant correlations between performance on the different tests, and many correlations were negative.
PCA analysis revealed 3 top components with eigenvalues > 1, each explaining 20-28% of variance. The top principal component did not correlate positively with all tests.
Fish: No
69 wild-caught female cleaner fish16 were given 4 cognitive tasks involving solving a spatial puzzle to get a food reward, distinguishing larger from smaller quantities of food, or learning that they could get more food by eating a less preferred type of food.
Upon applying PCA to the results, the top eigenvector had eigenvalue 1.16 and explained 38.5% of the variance; two tasks loaded positively on this factor while one loaded negatively.
There was no positive manifold; pairwise correlations were zero or negative.
Conclusions
Animal psychometric experiments are a lot weaker than human ones. Sample sizes are small, there are few cognitive tests, and the tests don’t always yield consistent results.
Overall, despite the limitations of the literature, there does seem to be a tendency for studies to find some kind of g structure in the individual differences in mammal cognition.
On the other hand, it’s not unusual for there not to be a strict “positive manifold”, or for there to be several principal factors with similar-sized eigenvalues explaining similar %s of the variance rather than a single factor that overwhelmingly dominates.
In some cases the idea of “animal g” comports well with folk wisdom — for instance, dog trainers tend to believe that some dogs are quicker than others to ‘catch on’ and learn new tricks in general.
It is intriguing that the clearest negative results on g are in fish and one out of two species of bird.
If cognitive skills overlap more in mammals than in other vertebrates, that would be consistent with a story in which mammals have some distinctive “brain feature” which is responsible for enhancing a variety of cognitive skills, while other animals, lacking this feature, have a more “modular” type of intelligence in which each skill is independent.
Mammals are, in fact, distinctive in having a large cerebral cortex, while fish lack a cerebral cortex altogether. (Reptiles and birds have a structure homologous to the cortex called the pallium.) So maybe it’s worth investigating what kinds of behavior you can and can’t do without a cortex.
Pluck, Graham, and Antonio Cerone. "A demonstration of the positive manifold of cognitive test inter-correlations, and how it relates to general intelligence, modularity, and lexical knowledge." Proceedings of the Annual Meeting of the Cognitive Science Society. Vol. 43. No. 43. 2021.
Hopkins, William D., Jamie L. Russell, and Jennifer Schaeffer. "Chimpanzee intelligence is heritable." Current Biology 24.14 (2014): 1649-1652.
Damerius, Laura A., et al. "General cognitive abilities in orangutans (Pongo abelii and Pongo pygmaeus)." Intelligence 74 (2019): 3-11.
Herndon, James G., et al. "Patterns of cognitive decline in aged rhesus monkeys." Behavioural brain research 87.1 (1997): 25-34.
Arden, Rosalind, and Mark James Adams. "A general intelligence factor in dogs." Intelligence 55 (2016): 79-85.
Pastrana, Carlos Iglesias, et al. "Study of variability of cognitive performance in captive fallow deer (Dama dama) through g and c factors." Journal of Veterinary Behavior 47 (2022): 70-85.
Livesey, Peter J. "Critique and comment. A consideration of the neural basis of intelligent behavior: Comparative studies." Behavioral Science 15.2 (1970): 164-170.
Anderson, Britt. "Evidence from the rat for a general factor that underlies cognitive performance and that relates to brain size: intelligence?." Neuroscience Letters 153.1 (1993): 98-102.
Crinella, Francis M., and Jen Yu. "Brain mechanisms in problem solving and intelligence: A replication and extension." Intelligence 21.2 (1995): 225-246.
Galsworthy, Michael J., et al. "Evidence for general cognitive ability (g) in heterogeneous stock mice and an analysis of potential confounds." Genes, Brain and Behavior 1.2 (2002): 88-95.
Galsworthy, Michael J., et al. "Assessing reliability, heritability and general cognitive ability in a battery of cognitive tasks for laboratory mice." Behavior genetics 35.5 (2005): 675-692.
Locurto, C., E. Fortin, and R. Sullivan. "The structure of individual differences in heterogeneous stock mice across problem types and motivational systems." Genes, Brain and Behavior 2.1 (2003): 40-55.
Matzel, Louis D., et al. "Individual differences in the expression of a “general” learning ability in mice." Journal of Neuroscience 23.16 (2003): 6423-6433.
Shaw, Rachael C., et al. "Wild psychometrics: evidence for ‘general’cognitive performance in wild New Zealand robins, Petroica longipes." Animal Behaviour 109 (2015): 101-111.
Keagy, Jason, Jean-François Savard, and Gerald Borgia. "Complex relationship between multiple measures of cognitive ability and male mating success in satin bowerbirds, Ptilonorhynchus violaceus." Animal Behaviour 81.5 (2011): 1063-1070.
Aellen, Mélisande, Judith M. Burkart, and Redouan Bshary. "No evidence for general intelligence in a fish." Ethology 128.5 (2022): 424-436.
I'm a bit confused: as covariance is a kernel, a covariance matrix is always positive semi- definite (proof: https://stats.stackexchange.com/questions/52976/is-a-sample-covariance-matrix-always-symmetric-and-positive-definite), and so the usual random matrix spectral theory doesn't apply, and the top eigenvalue value cannot be negative, and so is not described by the Tracy- Widom distribution. Correlation is also a kernel, so the correlation matrix is also positive semi- definite, and the same applies.
What am I missing?
Trying to be maximally charitable to Pinker here, what I think he meant was something along the lines of, sure, g exists, in humans, possibly in other animals, but is there any such thing as a cross-species g that applies to any thinking creature or machine whatsoever? I'm inclined to personally say probably yes, and I'm not totally certain he wouldn't agree even, but then you run into the further problem of how on earth we measure that. I thought that was what this post was gong to address after seeing the title, not whether we can compare non-humans animals to other individuals of their own species, but can be compare individuals of different species?
I still don't think this is necessarily the basis of any kind of strong case if your claim is that talking about intelligence in a general way that applies to all thinking creatures and machines is completely pointless or the word intelligence in itself can't possibly have a generally applicable meaning, but it is at least not obviously contradictory to the belief that g exists and can be measured.